Horse racing game win probability
When gathering with family, we like to play yard, card, and board games. On a recent visit, one of the favorite games was the Across the Board Kentucky Derby Horse Racing Game. The game produced a lot of cheers and jeers and provided a fun diversion with no skill and little concentration required. After losing a little money, though, I lost interest in playing the game and decided to write some R code to simulate the game and generate win probabilities.
The game involves dealing a deck of cards (with Kings and Aces removed) to any number of players (well, up to 44 players where each player would be dealt one card). The cards in a player’s hand represent wagers on the winning horse where horses are numbered 2-12 and the jack and queen cards represent 11 and 12, respectively. Two dice are rolled and the total of the dice determines which horse moves around the board. The number of steps for a horse to win is scaled roughly in proportion to the probability of that number being rolled. Below we enumerate all of the possible rolls with expand.grid, calculate the probability of each roll, and compare those probabilities to the probabilities based on the number of steps included on the game board.
rolls_df = expand.grid(dice1 = 1:6, dice2 = 1:6) |>
  dplyr::mutate(roll = dice1 + dice2) |>
  dplyr::count(roll) |>
  dplyr::mutate(
    steps = c(3, 6, 8, 11, 14, 16, 14, 11, 8, 6, 3),
    prob = n / sum(n),
    prob_steps = steps / sum(steps)
  )

> rolls_df

   roll n steps       prob prob_steps
1     2 1     3 0.02777778       0.03
2     3 2     6 0.05555556       0.06
3     4 3     8 0.08333333       0.08
4     5 4    11 0.11111111       0.11
5     6 5    14 0.13888889       0.14
6     7 6    16 0.16666667       0.16
7     8 5    14 0.13888889       0.14
8     9 4    11 0.11111111       0.11
9    10 3     8 0.08333333       0.08
10   11 2     6 0.05555556       0.06
11   12 1     3 0.02777778       0.03
We can use the sample function to simulate rolling the dice. sample.int provides better performance, but requires adding 1L to shift our samples from 1:11 to our horse numbers of 2:12.
roll <- function(n, replace = TRUE, prob = rolls_df$prob) {
  sample.int(11, size = n, replace = replace, prob = prob) + 1L
}

> round(table(roll(500000))/500000, 3)

    2     3     4     5     6     7     8     9    10    11    12
0.028 0.055 0.084 0.111 0.139 0.167 0.139 0.111 0.083 0.056 0.028
With this board setup, all horses have a roughly equal probability of winning because the horses that are rolled more rarely have fewer steps to move around the board. The game dynamics are made more interesting by introducing scratches, i.e., horses that are not able to participate in a race. We can use our roll function to generate the scratches. The number of scratches is always four different horses.
> roll(4, replace = FALSE)
[1] 8 5 4 3
The scratches determine how much players must contribute to the kitty. The first scratch horse is 1x and the last is 4x. Players pay the scratch value for every card in their hand that matches a scratch horse. We played with quarters so the starting kitty was always $10. Every time a player rolls a value that matches the scratch horse, they have to contribute that scratch amount to the kitty. The following function calculates the value of the kitty given a vector of dice rolls. In the example below, each rolled 7 would require the player to put a quarter in the kitty and the 10 would require $0.75.
get_kitty <- function(base_value, scratches, rolls = NULL) {
  init = 4 * base_value * (4 + 3 + 2 + 1) # multiply by 4 for 4 suits in deck
  vals = NULL
  if (!is.null(rolls) && length(rolls) > 0) {
    vals = sapply(rolls, function(x) {
      mult = which(scratches == x) # index in scratches indicates multiplier
      if (length(mult) > 0) mult * base_value else 0
    })
  }
  sum(c(init, vals))
}

> base_value = 0.25
> scratches = roll(4, FALSE)
> rolls = roll(5)
> scratches
[1]  7  3 10  9
> rolls
[1]  7  4  6  7 10
> get_kitty(base_value, scratches)
[1] 10
> get_kitty(base_value, scratches, rolls)
[1] 11.25
Rather than trying to do the math to determine how likely each horse is to win. I used Monte Carlo simulations to find the win probabilities for any point in a game (described by vector of rolls). I’ve covered most of the basic logic of the calculations here, but all of the code is available through GitHub.
sim_one_game <- function(scratches, rolls, winner_only = TRUE) {
  steps_remain = get_steps_remain(scratches, rolls)
  active = !is.na(steps_remain)
  sr = steps_remain
  if (any(sr[active] < 0)) {
    stop("Winner was already determined")
  }
  # conservative choice; highly unlikely to need 200 rolls to finish a game
  sim_rolls_pool = roll(200)
  i = 1
  while (all(sr[active] > 0)) {
    r = sim_rolls_pool[i] # integer 2–12
    i = i + 1
    idx = r - 1L # integer 1–11
    if (active[idx]) {
      sr[idx] = sr[idx] - 1L
    }
  }
  winner = names(which(sr == 0))
  if (winner_only) {
    winner
  } else {
    sim_rolls = sim_rolls_pool[seq_len(i - 1)] # trim to actual length
    list("winner" = winner, "rolls" = c(rolls, sim_rolls))
  }
}
I ran 100,000 simulations of the game to determine which horses win most often. 2 or 12 each win about 20% of the time, 3/11 and 4/10 ~ 9.5%, 5/9 = 5.5%, 6/7/8 = 3.5%. The primary driver behind that outcome is that 2 and 12 are less likely to end up as scratches than 3 and 11 and so on. 4/10 have roughly the same win probability as 3/11, despite 4/10 requiring more steps to move around the board than 3/11, which is a byproduct of how the board is discretized and is evident in rolls_df where the prob is higher than the prob_steps for 4/10. Same idea applies to why 7 has a similar win probability to 6/8.
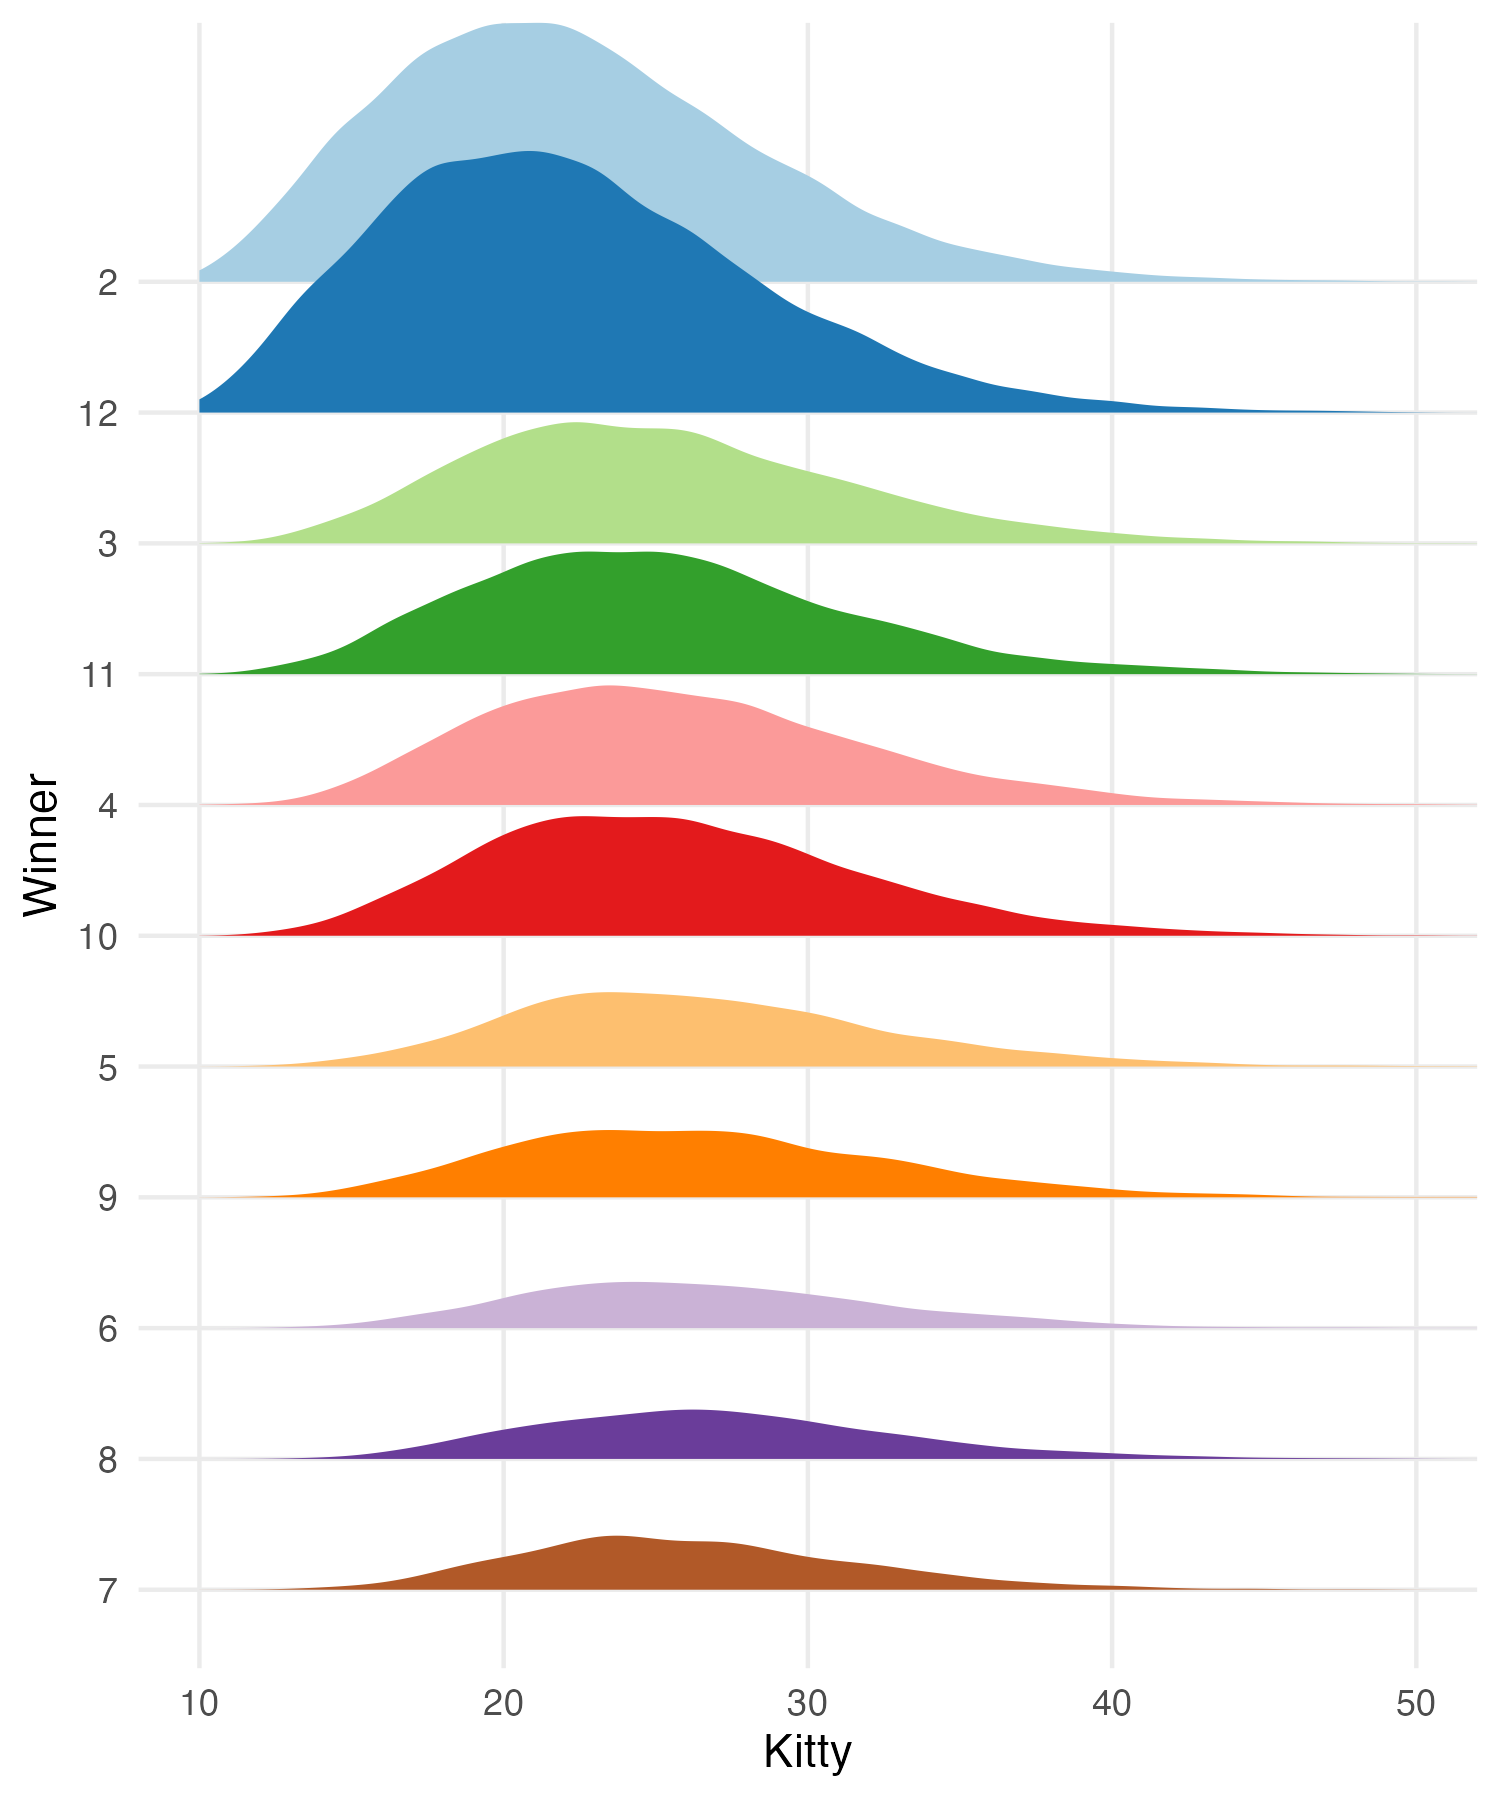
The figure below shows the kitty distribution paneled by the winning horse for those 100,000 simulated games with a base value of $0.25. The overall average kitty was $24.45 with the winner-specific averages ranging from $22.30 (12) to $26.80 (8). The kitty grows largest in games where 6/7/8 win because it takes the most steps for those horses to make it around the board.
Lastly, I thought it would be fun to record the game live and provide updates on which horse was most likely to win as the game progressed. I was initially doing that within my original R script, but I decided to make a Shiny app to facilitate that process. The app layout is not great and it is missing some useful functionality (e.g., roll history not displayed and not able to undo if wrong button was clicked).
UPDATE (2026-04-01): I have been resistant to adopting AI. I would like to say that my resistance was born of noble intentions based on environmental and ethical concerns, but it arguably arose more from my negative emotions related to AI potentially taking away my favorite tasks at work. Recently, though, I have started experimenting with Claude and found myself enjoying finishing long languishing side projects. One example was improving my little Shiny app for the horse game. It is now much more compact and useable on a mobile device. The new version includes the roll history, an undo button, and disabling of inputs for invalid states. I also dropped the plots in favor of a cleaner approach with value boxes.
My initial version performed a lot of the calculations within dataframes using dplyr functionality. I found that approach intuitive, but it was slow so I rewrote it with the vector approach (see repo).